I am using Cobertura:
http://diymiddleware.sourceforge.net/coverage/index.html
Tuesday, November 6, 2007
Further decoupling

After some intensive refactoring, I finally arrived to the architecture where server and client do not depend on transport level. They communicate to the network via Transport object, which maintains remote connections, reads data from the peer, packages them into frame objects, and sends frame objects to the remote peer. In fact, both server and client can use the same transport implementation. Transport needs some source of connection though. In the case of server, connections come from the Acceptor, who's job is accepting incoming connections on the ServerSocket and feeding them to the Transport. In the case of client, Connector object takes direct calls from the Client in order to initiate connection. Transport is normally unaware if it works for the server or for the client.
Another interesting feature of this design is the communication media between almost all components. They do not use callbacks, this prevents them from interfering with each other's threading model. Instead, they communicate through queues. These queues can be created and configured/customized in the spring configuration file. At present, they are all LinkedBlockingQueue without limit, but any other implementation/configuration is easily possible.
Wednesday, October 17, 2007
Unit test fixed
In order to fix my first unit test, I had to introduce acknowledgments to the subscription requests. Server would simply reply to the "REC" message with the identical one. Having received this message back, client can be sure that subscription is in place and messages will be delivered (this is exactly what this unit test is testing).
However, client code gets messy because of callback architecture. It will be re-engineered in a same way as for the server - decoupling actual client from connector. Theoretically, connectors could even be the same for both server and client. Only session feed would differ - on the server sessions are created upon accepting client connections, whereas on the client they are user-initiated.
However, client code gets messy because of callback architecture. It will be re-engineered in a same way as for the server - decoupling actual client from connector. Theoretically, connectors could even be the same for both server and client. Only session feed would differ - on the server sessions are created upon accepting client connections, whereas on the client they are user-initiated.
Monday, October 15, 2007
First unit test for the server
I have written a Junit test for the server distribution functionality (DistributionTest). It has been quite easy after decoupling work done before.
First test simply connects a session to the server.
Second test tries to connect two sessions and subscribe both of them to all incoming messages (using regex pattern ".*"). Then, it sends one message from each session and excepts it to be received by both. This tests shows (it actually fails for now) that it is necessary to have a way to acknowledge the completion of subscription ("REC" command). Test needs it to know when to proceed with sending messages, so would many applications do.
Thursday, October 11, 2007
Decouple connector from Server
Before we move on to upgrading messaging server to using NIO, it make sense to decouple the part of functionality that deals with I/O into separate component that can be easily swapped. Therefore I have introduced Connector. Communication between connector and server is done via two queues: one queue is input queue for the server and output queue for the connector and another one - output queue for the server and input queue for the connector. These queues are holding SessionCommand objects. At the moment, two types of SessionCommands are supported:
1) QUEUE (connector->server). When a new client connection is made, connector creates a queue that will pass data frames from the server via connector to the client. This queue is specified in the QUEUE command that connector sends to the server. This command also included unique session ID, generated by the connector.
2) QUEUE (server->connector). Once the server has received the QUEUE command from the connector, it creates another queue (or re-uses previously created one) that will pass data frames from the client via connector to the server. This queue is specified in the QUEUE command that the server sends back to the connector.
3) CLOSE (connector->server). If client closes its connection, or an I/O exception happens during reading/writing on the client connection, connector sends CLOSE command to the server, informing that session has been closed. If the cause was an exception, it will be passed in the command.
4) CLOSE (server->connector). Server may decide to close session, so it asks connector to close connection by sending CLOSE command. At the moment, this use case is not present in the code.
Decoupling means that the server now works only with SessionCommands and data frames (class Frame). There are no callbacks between server and connector either, so there is no thread-dependencies.
QueueSizeMonitor is now injected in both server and connector. They update counters for the distribution queue and output queue whenever they put/take values from them.
Thursday, October 4, 2007
NIO based client
I have refactored the client program (now still named Client1), used in the tests. It is now based on non-blocking I/O and uses it features such as buffers, socket channels, selectors and charset encoders/decoders.
Client program has a single thread doing I/O and three groups of other threads:
1) Encoder threads. Since all messages are strings, they have to be converted to byte arrays before being sent to the sockets. Encoder threads take stings as input and produce byte buffers ready to inject into sockets (this injection is done by the I/O thread). Encoder threads are implemented in the form of a thread pool executor with specified number of threads.
2) Decoder threads. Once data (in form of byte buffers) have been read from the sockets by I/O threads, they need to be converted to strings to be able to process by the application. This work is done by decoder threads.
3) Callback threads. When an application is subscribing to messages (using a filter), it passes the callback to the client program. This callback gets called by callback threads (implemented as a thread pool). Callbacks are also called to propagate session exceptions within the client.
Sunday, September 30, 2007
Spring container
In order to make server more modular, I have put it into a spring container. It only contains one bean at the moment, but I am planning to make queueSizeMonitor and connector (based on blocking I/O) separate pluggable modules. This way, it would be possible:
1) To easily turn off queue size monitoring if necessary (by creating a dummy monitor, which does not do anything)
2) To create non-blocking I/O based connector and compare gain in performance and/or scalability
1) To easily turn off queue size monitoring if necessary (by creating a dummy monitor, which does not do anything)
2) To create non-blocking I/O based connector and compare gain in performance and/or scalability
Saturday, September 29, 2007
Routing optimization
Having run the server under profiler, I noticed a main things that could be optimized:
There are too many objects being created during pattern-matching process (you can see it by analyzing the monitor usage and see that code is blocked on the "Reference$Lock" objects, which is a sign of heavily using the CG). It is more efficient to re-use Matcher objects and call "reset" on the them than to create them every time from the Pattern object.
Because re-usable Matcher objects are now stateful (unlike Pattern objects), we create a copy of Matcher object per dispatcher thread.
After having applied the optimization, we have the following results from the same tests:
Publish rate: 34447.12366517396
Average delay: 276 ms
Max delay: 1213 ms
Received: 100000 messages
Publish rate: 26917.900403768504
Average delay: 1370 ms
Max delay: 3419 ms
Received: 100000 messages
Publish rate: 55243.09392265193
Average delay: 2196 ms
Max delay: 4347 ms
Received: 99990 messages
Publish rate: 20951.183741881418
Average delay: 933 ms
Max delay: 4134 ms
Received: 100000 messages
Publish rate: 22311.468094600627
Average delay: 943 ms
Max delay: 4614 ms
Received: 100000 messages
Publish rate: 17201.858544140425
Average delay: 2498 ms
Max delay: 5261 ms
Received: 99960 messages
Publish rate: 15284.40366972477
Average delay: 1157 ms
Max delay: 6499 ms
Received: 99960 messages
Publish rate: 14194.464158977999
Average delay: 1782 ms
Max delay: 6815 ms
Received: 100000 messages
Publish rate: 13719.813391877058
Average delay: 658 ms
Max delay: 7166 ms
Received: 99990 messages
Publish rate: 17689.72227136034
Average delay: 1910 ms
Max delay: 6620 ms
Received: 100000 messages

Thursday, September 13, 2007
Cleaner queue monitoring
After some time off this little projects and more thoughts, I returned with much cleaner and simpler design for queue monitor. We are still keeping thread-local map of counters. However, they are not aggregated from the same threads. Instead, we create a registry of such maps. Every entry in the registry is keyed by a phantom reference to another thread-local object. This allows cleaning up the registry in the case when threads are disappearing. All statistics, gathered from disappeared threads, is accumulated in a special "deads" map.
Every specified interval of time, a timer thread is iterating through the registry and calculates aggregated monitored values. It also takes into account "deads" map and cleans up registry entries for the dead threads, if necessary.
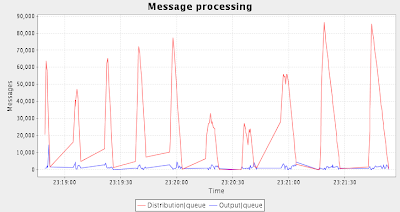
This time, I decided to observe only 2 values: Size of Distribution Queue and size of all Output Queues.
Here is the console output of the test program and resulting graph:
Publish rate: 77942.3226812159
Average delay: 1471 ms
Max delay: 2680 ms
Received: 100000 messages
Publish rate: 43047.78303917348
Average delay: 1854 ms
Max delay: 3772 ms
Received: 100000 messages
Publish rate: 51435.18518518518
Average delay: 2169 ms
Max delay: 4338 ms
Received: 99990 messages
Publish rate: 56116.72278338945
Average delay: 2866 ms
Max delay: 6050 ms
Received: 100000 messages
Publish rate: 47483.38081671415
Average delay: 2987 ms
Max delay: 6108 ms
Received: 100000 messages
Publish rate: 48219.97105643994
Average delay: 3192 ms
Max delay: 6768 ms
Received: 99960 messages
Publish rate: 47873.5632183908
Average delay: 3230 ms
Max delay: 6775 ms
Received: 99960 messages
Publish rate: 31645.569620253165
Average delay: 4531 ms
Max delay: 8746 ms
Received: 100000 messages
Publish rate: 39615.68938193344
Average delay: 5171 ms
Max delay: 10623 ms
Received: 99990 messages
Publish rate: 49188.391539596654
Average delay: 5008 ms
Max delay: 10190 ms
Received: 100000 messages
Every specified interval of time, a timer thread is iterating through the registry and calculates aggregated monitored values. It also takes into account "deads" map and cleans up registry entries for the dead threads, if necessary.
This time, I decided to observe only 2 values: Size of Distribution Queue and size of all Output Queues.
Here is the console output of the test program and resulting graph:
Publish rate: 77942.3226812159
Average delay: 1471 ms
Max delay: 2680 ms
Received: 100000 messages
Publish rate: 43047.78303917348
Average delay: 1854 ms
Max delay: 3772 ms
Received: 100000 messages
Publish rate: 51435.18518518518
Average delay: 2169 ms
Max delay: 4338 ms
Received: 99990 messages
Publish rate: 56116.72278338945
Average delay: 2866 ms
Max delay: 6050 ms
Received: 100000 messages
Publish rate: 47483.38081671415
Average delay: 2987 ms
Max delay: 6108 ms
Received: 100000 messages
Publish rate: 48219.97105643994
Average delay: 3192 ms
Max delay: 6768 ms
Received: 99960 messages
Publish rate: 47873.5632183908
Average delay: 3230 ms
Max delay: 6775 ms
Received: 99960 messages
Publish rate: 31645.569620253165
Average delay: 4531 ms
Max delay: 8746 ms
Received: 100000 messages
Publish rate: 39615.68938193344
Average delay: 5171 ms
Max delay: 10623 ms
Received: 99990 messages
Publish rate: 49188.391539596654
Average delay: 5008 ms
Max delay: 10190 ms
Received: 100000 messages

Tuesday, August 21, 2007
Queue size monitoring
One of the things we would like to build into the server before moving on to any features and improvements is monitoring. First of all, we will measure queues' growth.
Monitoring is always a trade-off between overhead and precision. In our monitoring class, QueueSizeMonitor, we will have a parameter, called granularity, in milliseconds. It determines how often the measurements are taken. What does "take measurement" mean here?
Our monitoring of queue sizes is based on "counting". Messaging server calls count(long delta, String key) method on the monitoring object every time when the size of any queue changes. Argument delta is the value of the change. Argument key would normally be an event name (like queue X grows, queue X shrinks). This method accumulates values in a thread-local storage (i.e. every thread has its own copy of the counter). Every now and then (depending on granularity value) data from thread-local storages are promoted to the common storage. This operation entails some locking, that is why the smaller is the granularity, the bigger is the overhead of monitoring.
A background thread periodically flushes collected data to a file. Frequency of such flushing is determined by the window parameter. Flushing interval = granularity * window. File is written in XML format that looks like following:
Although the queue size monitor adds data dynamically, the XML file it produces is always well-formed. This is because it shifts position in the file back by 9 bytes (size of the </series> tag), then writes several <serie> tags, then adds </series> in the end. In most cases, XML will be well-formed even if the server crashes.
I haven't worked out yet the best set of values to monitor and the best way of representing them. However, as a start, I added simple class Chart that parses XML produced by the queue size monitor and shows line chart. It doesn't look very useful at the moment:

Monitoring is always a trade-off between overhead and precision. In our monitoring class, QueueSizeMonitor, we will have a parameter, called granularity, in milliseconds. It determines how often the measurements are taken. What does "take measurement" mean here?
Our monitoring of queue sizes is based on "counting". Messaging server calls count(long delta, String key) method on the monitoring object every time when the size of any queue changes. Argument delta is the value of the change. Argument key would normally be an event name (like queue X grows, queue X shrinks). This method accumulates values in a thread-local storage (i.e. every thread has its own copy of the counter). Every now and then (depending on granularity value) data from thread-local storages are promoted to the common storage. This operation entails some locking, that is why the smaller is the granularity, the bigger is the overhead of monitoring.
A background thread periodically flushes collected data to a file. Frequency of such flushing is determined by the window parameter. Flushing interval = granularity * window. File is written in XML format that looks like following:
<series>
<serie timestamp="1187734787600">
<item key="10|poll" value="54"/>
<item key="1|poll" value="165"/>
<item key="2|poll" value="4"/>
<item key="Distribution|poll" value="112"/>
<item key="Distribution|put" value="109"/>
</serie>
<serie timestamp="1187734787700">
<item key="1|poll" value="193"/>
<item key="2|poll" value="258"/>
<item key="4|poll" value="18"/>
<item key="5|poll" value="430"/>
<item key="7|poll" value="4"/>
<item key="8|poll" value="2"/>
<item key="Distribution|poll" value="452"/>
<item key="Distribution|put" value="454"/>
</serie>
</series>
Although the queue size monitor adds data dynamically, the XML file it produces is always well-formed. This is because it shifts position in the file back by 9 bytes (size of the </series> tag), then writes several <serie> tags, then adds </series> in the end. In most cases, XML will be well-formed even if the server crashes.
I haven't worked out yet the best set of values to monitor and the best way of representing them. However, as a start, I added simple class Chart that parses XML produced by the queue size monitor and shows line chart. It doesn't look very useful at the moment:

Monday, August 13, 2007
First files checked in
My project at sourceforge has been approved. So I have uploaded first source code:
http://diymiddleware.cvs.sourceforge.net/diymiddleware/
There are three files there:
http://diymiddleware.cvs.sourceforge.net/diymiddleware/
There are three files there:
- Server1.java. You can run the server (does not require any arguments). It will try to bind to the port 22221 and listen for incoming client connection. Server never stops on its own, so you have to terminate it forcibly.
- Client1.java. Non-runnable API-like client for the server. In order to use it, you need to instantiate it, passing host name of the server (DNS or IP address) as the argument. It will create a thread, which will be used to call your callbacks when you want to receive messages. Method "close" should be called in the end, it interrupts the thread. Three methods of this class correspond to the commands that the server understand:
- consume. Sends "REC" command. Takes regex pattern and callback. When there is a message sent, part of which matches the pattern, callback gets called (by only one thread per client instance).
- stop. Sends "STOP" command, canceling current "REC" subscription.
- send. Sends "M" command, which actually publishes message to the server.
- Test1.java. Test program. Helps obtain some benchmarks. Currently, it tries to send 100 thousand messages of specified length to the server, using specified number of senders (each sender is an instance of Client1 class). There are also specified number of receivers (each receiver is an instance of Client1 class too). Senders send messages concurrently. Each sender sends equal number of messages, with total number around 100,000. First sender includes a string "P1P" into message, second one includes "P2P" and so on. First receiver subscribes to patter "P1P", second one - to "P2P" and so on. Hence, if number of senders more than number of receivers, some messages will not be received by anyone. Test measures 3 things:
- Average sending rate (messages per second). This is total number of sent messages divided by the total time spent on sending (only sending, not delivering).
- Average message delay. Every sender inserts current timestamp into message. Every receiver reads it and calculates delay.
- Maximum message delay.
Sunday, August 12, 2007
What is this all about
Last Thursday I spent few hours writing sample messaging middleware in Java (for a presentation on high-rate messaging in Java). I called it "DIY messaging server", "DIY messaging client" and "DIY messaging test". Features were:
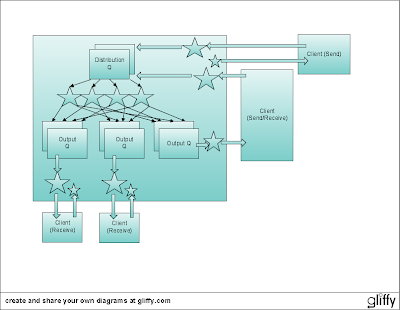
Here is the architecture. Clients can be either senders, or receiver or both at the same time. Every client has an open socket to the server (two arrows between client and server). Within the server, every client connection is serviced by two threads (shown as stars). When client is sending messages, corresponding thread reads them off the input stream of the socket and places into the distribution queue. Distribution queue is accessible to a number of distributor threads (4 stars in the middle of the server). Using their routing rules, which are updated by "REC" and "STOP" commands, these distributor threads are placing every message into zero, one or many output queues (there is one output queue per connected client that is currently interested in messages). Output queues are dispatched by the threads attached to the output streams of the sockets.
My next steps:
- All messages are Java Strings
- A client can do 3 things to the server:
- "REC" (followed by a regular expression) - express interest in receiving all messages containing given regular expression
- "STOP" stop receiving any messages
- "M" (followed by a string) - send message for delivery
- Only one "subscription" per connected client is possible - any "REC" command cancels the effect of previous one.
- There is no acknowledgment and no flow control - i.e. senders are not getting any feedback from the server

Here is the architecture. Clients can be either senders, or receiver or both at the same time. Every client has an open socket to the server (two arrows between client and server). Within the server, every client connection is serviced by two threads (shown as stars). When client is sending messages, corresponding thread reads them off the input stream of the socket and places into the distribution queue. Distribution queue is accessible to a number of distributor threads (4 stars in the middle of the server). Using their routing rules, which are updated by "REC" and "STOP" commands, these distributor threads are placing every message into zero, one or many output queues (there is one output queue per connected client that is currently interested in messages). Output queues are dispatched by the threads attached to the output streams of the sockets.
My next steps:
- Upload the current code somewhere to sourceforge and get Subversion access to it, so I can specify revision number for every blog entry
- Simple monitoring of the distribution queue and output queues. Monitoring will include size of the queues and also contribution of every sender
- Flow control post + simple flow control implementation. Judgment for flow control will be based on monitoring values and some parameters known as "watermark values"
- Post about unfairness of flow control
- Re-writing the code to use non-blocking I/O. This is first of all to compare performance and scalability (with flow control on)
- Post about TTL (Time-To-Live) as an alternative to Flow Control, which is more fair, but could lead to data loss. Concerns about memory usage because of keeping TTL.
- Flush messages to disk to avoid excessive memory consumption when using long TTL. Rotate the files in order to avoid indexing and use of embedded databases etc.
- Some other cool stuff to come...
Subscribe to:
Posts (Atom)